
Zhi Dongxi
Author | ZeR0
Editor | Mo Ying
On March 13, Zhi Dongxi reported that the well-known AI application Claude has introduced new features! Claude can now create interactive charts, diagrams, and other visual content directly in chat, with the ability to adjust and modify these visuals at any time.
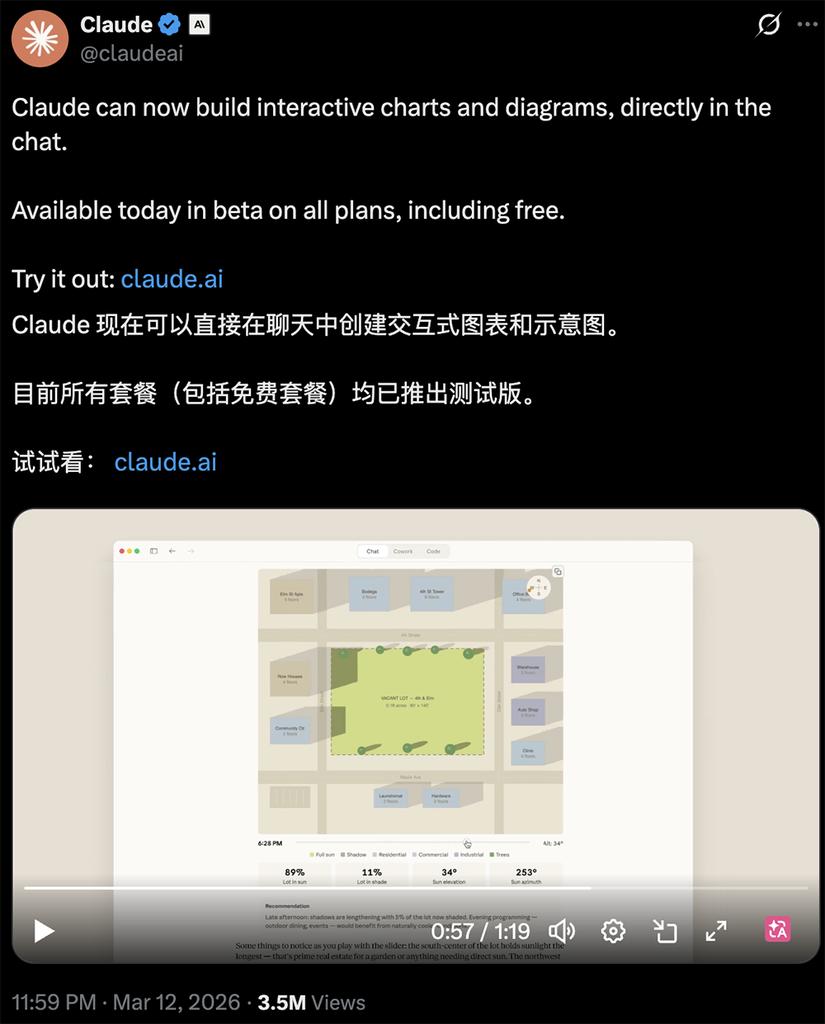
Last night, Anthropic integrated zero-code real-time visualization into Claude’s chat interface. Any user can experience this feature for free in its testing phase.
The operation is simple; just input a sentence, and Claude can output a complete interactive dynamic visualization in seconds.
For example, typing “Create an interactive version of the periodic table” will yield a moving periodic table, where clicking on any element reveals detailed information below.
If input in Chinese, the generated periodic table will be in Chinese.
Previously, Anthropic has been likened to a “Thanos” in the tech world, as new features have often led to stock drops in software companies, repeatedly “taking away jobs from entire industries.”
David Hendrickson, author of “Generative Software Engineering,” and many users expressed on social media X that this new feature is incredibly useful, suggesting that Claude might disrupt another industry and eliminate a number of AI startups.
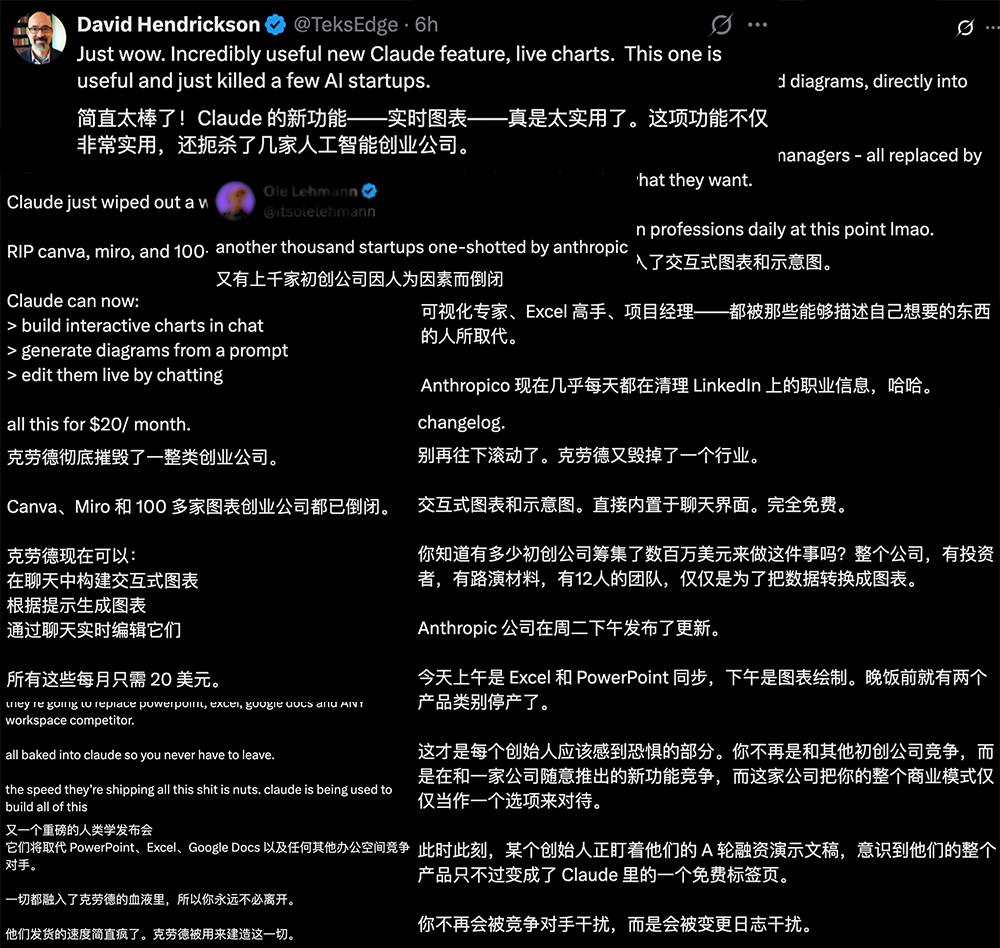
Entrepreneur Gorey Ganim remarked, “Mourning Canva, Miro, and over 100 other SaaS startups.”

“Anthropic really wants to take everyone’s job,” commented Wes Winder, founder of the top programming community on X. “The monthly $20 icon drawing and dashboard SaaS tools industry is now over; Claude has made them obsolete… A 16-year-old and Claude now have data visualization tools better than what a Fortune 500 company had in 2020.”
Zhi Dongxi tested interactive chart generation in 10 scenarios for reference:
1. Life Decisions
Prompt: I want to grow plants at home; please create an interactive ‘Plant Survival Probability Predictor’. Let me select environmental factors (light intensity, watering frequency, humidity, whether I have a cat) on the left, display a dynamic chart showing the plant’s health curve for the next 30 days in the middle, and generate a pixel art plant status image (wilted, thriving, or eaten by a cat) on the right based on my selections.
2. Learning Optimization
Prompt: Generate a tool to show how different learning methods (reading, practice, review) affect memory curves.
3. Science Education
Prompt: Generate an interactive diagram of human heart circulation, showing how blood flows.
4. Cosmic Operations
Prompt: Create an interactive solar system model that allows users to drag a timeline to observe how planetary orbits change over time.
5. Financial Management
Prompt: Show me how compound interest works.
6. Business Process Modeling
Prompt: Draw a flowchart showing the customer onboarding process from registration to first purchase.
7. Workplace Productivity Tools
Prompt: Help me create a “Startup Survival Stress Test Dashboard”. Allow me to input initial funding, number of employees, average salary, and monthly growth rate. Please generate a dynamic dashboard in real-time that shows my ‘cash flow depletion countdown’ and uses colors to warn of risks. Clicking different areas of the dashboard should pop up targeted ‘cost-saving suggestions’ or ‘funding strategies’.
8. Engineering Principles
Prompt: Show how different bridge structures (suspension bridge, arch bridge, beam bridge) distribute weight.
9. Traffic Congestion Simulation
Prompt: Create a city traffic simulator that allows users to add buses, subways, or bike lanes and observe how traffic congestion changes.
10. Carbon Emission Impact
Prompt: Generate a tool that allows users to adjust greenhouse gas emissions and observe future temperature trends.
Claude will also provide logic and usage instructions below the generated charts.
Anthropic has shared several official examples:
-
For those who enjoy sketching, visiting old buildings, and solving 3D puzzles, what are good professions? Plan career paths with these characteristics.
-
Oh no, my structural engineering course is getting harder. How does the load of a building transfer from the roof all the way down to the ground?
- There is an empty lot near my home that I can’t help but imagine its future appearance every time I pass by. Before I start designing, I want to understand the light conditions there. Can you build a tool to simulate how shadows move throughout the day?
- I am graduating next week!! I can’t help but recall that this all started from a shadow study of that empty lot. At that time, 340 neighbors participated and provided feedback, and the city government had just listed this place for park development. Can you present the entire process in a visual format?

This feature is enabled by default, and Claude will determine when to generate visual charts. You can also directly issue commands like “draw a chart” or “visualize changes over time.”
The above cases mainly combine search and other functions; you can also upload your own data and files, allowing Claude to generate charts based on your specific information, and request adjustments or deeper analysis after it outputs.
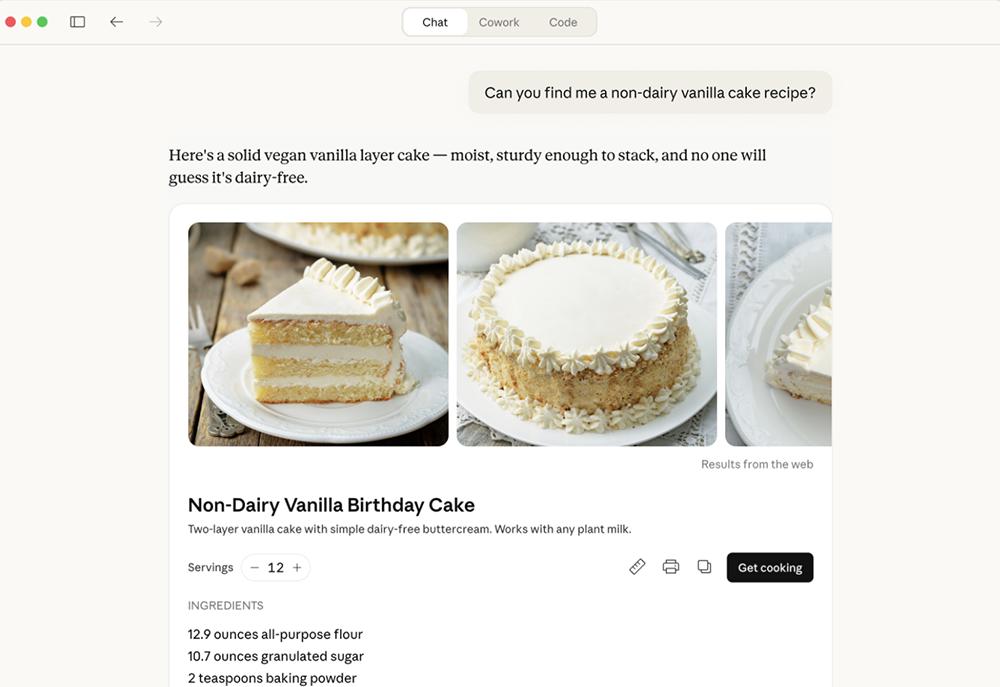
Earlier this year, Claude began using specially designed formats for certain topics; for example, recipes now display ingredients and steps, and when asked about the weather, Claude also provides visual effects.
You can also interact directly with applications like Figma, Canva, and Slack in chat.
All users can experience these features.
Additionally, Claude for Excel and Claude for PowerPoint now sync seamlessly. When you open multiple files, Claude shares complete conversational context between them, meaning shared memory. You can extract data from spreadsheets, create tables, and update PPTs without having to explain any steps again.
Claude for Excel and Claude for PowerPoint are also expanding their availability on Amazon Bedrock, Google Cloud’s Vertex AI, and Microsoft Foundry. These plugins are currently available in beta for all paid users, supporting both Mac and Windows systems.
Comments
Discussion is powered by Giscus (GitHub Discussions). Add
repo,repoID,category, andcategoryIDunder[params.comments.giscus]inhugo.tomlusing the values from the Giscus setup tool.